Cities with the Highest (and Lowest) Rates of Depression
The number of Americans diagnosed with clinical depression has been on the rise over the past few years, with an increase of 17.8 percent between 2016 and 2017 alone. Unfortunately, this may underestimate the problem, since more than half of those with a mental illness receive no type of treatment. Since access to medical care restricted for so many, it's not hard to understand why people do not pursue types of treatment.
Read more


Table of Contents
Table of Contents

Licensed Insurance Producer
Dani Best has been a licensed insurance producer for nearly 10 years. Dani began her insurance career in a sales role with State Farm in 2014. During her time in sales, she graduated with her Bachelors in Psychology from Capella University and is currently earning her Masters in Marriage and Family Therapy. Since 2014, Dani has held and maintains licenses in Life, Disability, Property, and Casualt...
Dani Best

Licensed Insurance Broker
Zach Fagiano has been in the insurance industry for over 10 years, specializing in property and casualty and risk management consulting. He started out specializing in small businesses and moved up to large commercial real estate risks. During that time, he acquired property & casualty, life & health, and surplus lines brokers licenses. He’s now the Senior Vice President overseeing globa...
Zach Fagiano
Updated November 2023
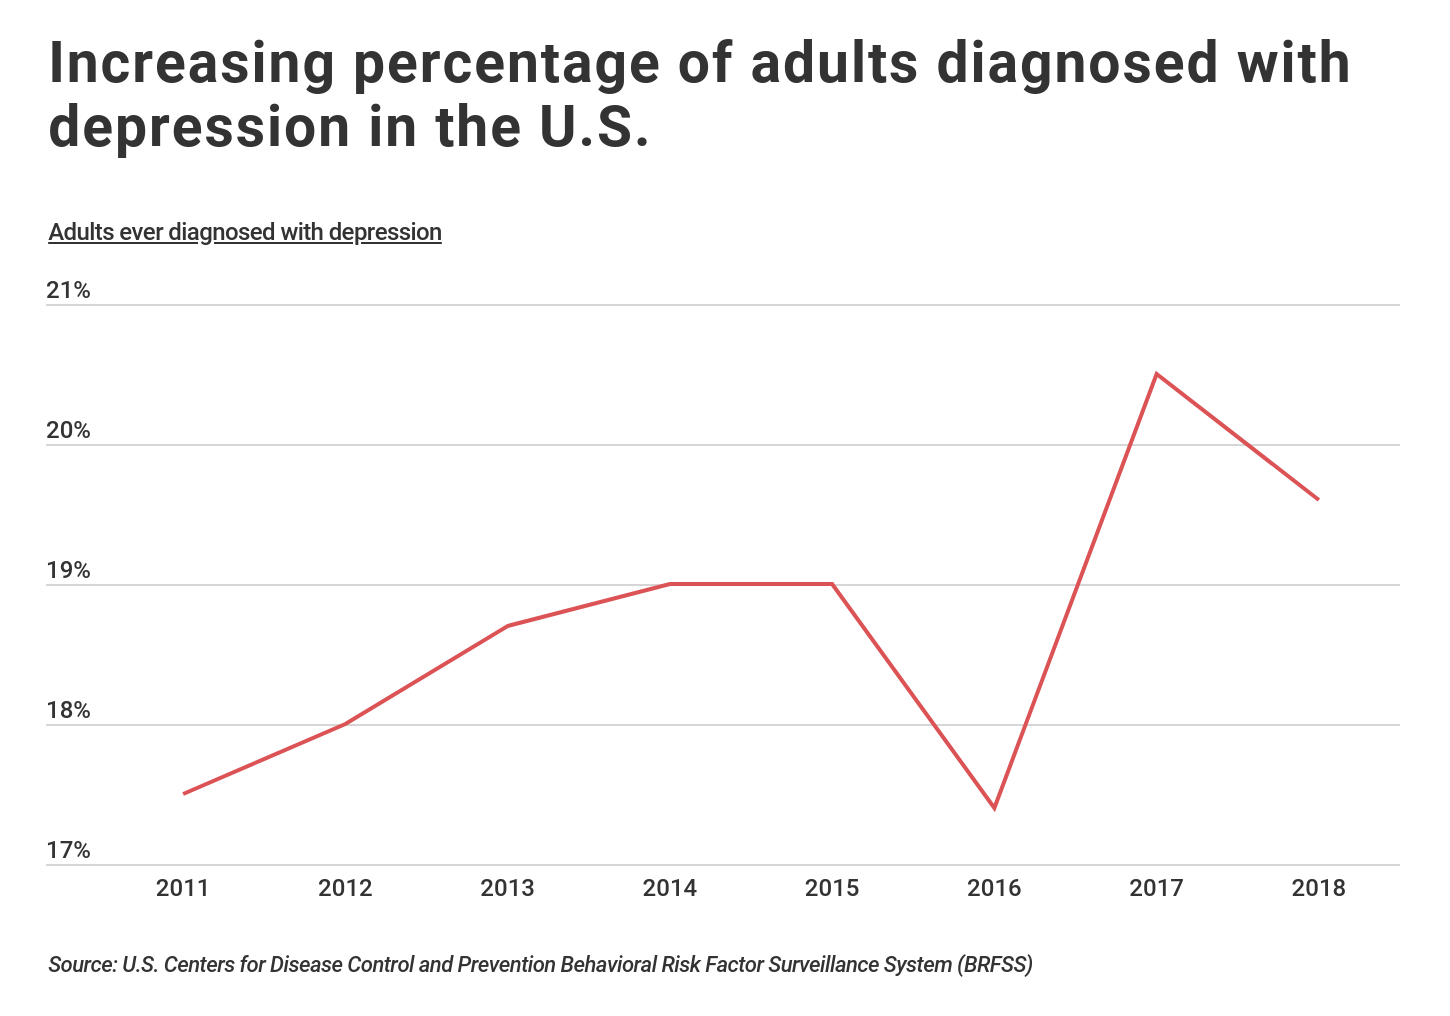
While the U.S. has long been a global leader in healthcare and medicine, the nation is losing its battle with mental health. According to data from the Centers for Disease Control and Prevention BRFSS Survey, almost one in five Americans have been diagnosed with depression at some point in their lives.
The number of Americans diagnosed with clinical depression has been on the rise over the past few years, with an increase of 17.8 percent between 2016 and 2017 alone. Unfortunately, this may underestimate the problem, since more than half of those with a mental illness receive no type of treatment. Since access to medical care restricted for so many, it’s not hard to understand why people do not pursue types of treatment.
Mental health is a complex phenomenon affected by myriad factors, such as genetics, stress, environment, and physical health. For example, stressful life events are associated with an increased risk of mental health problems.
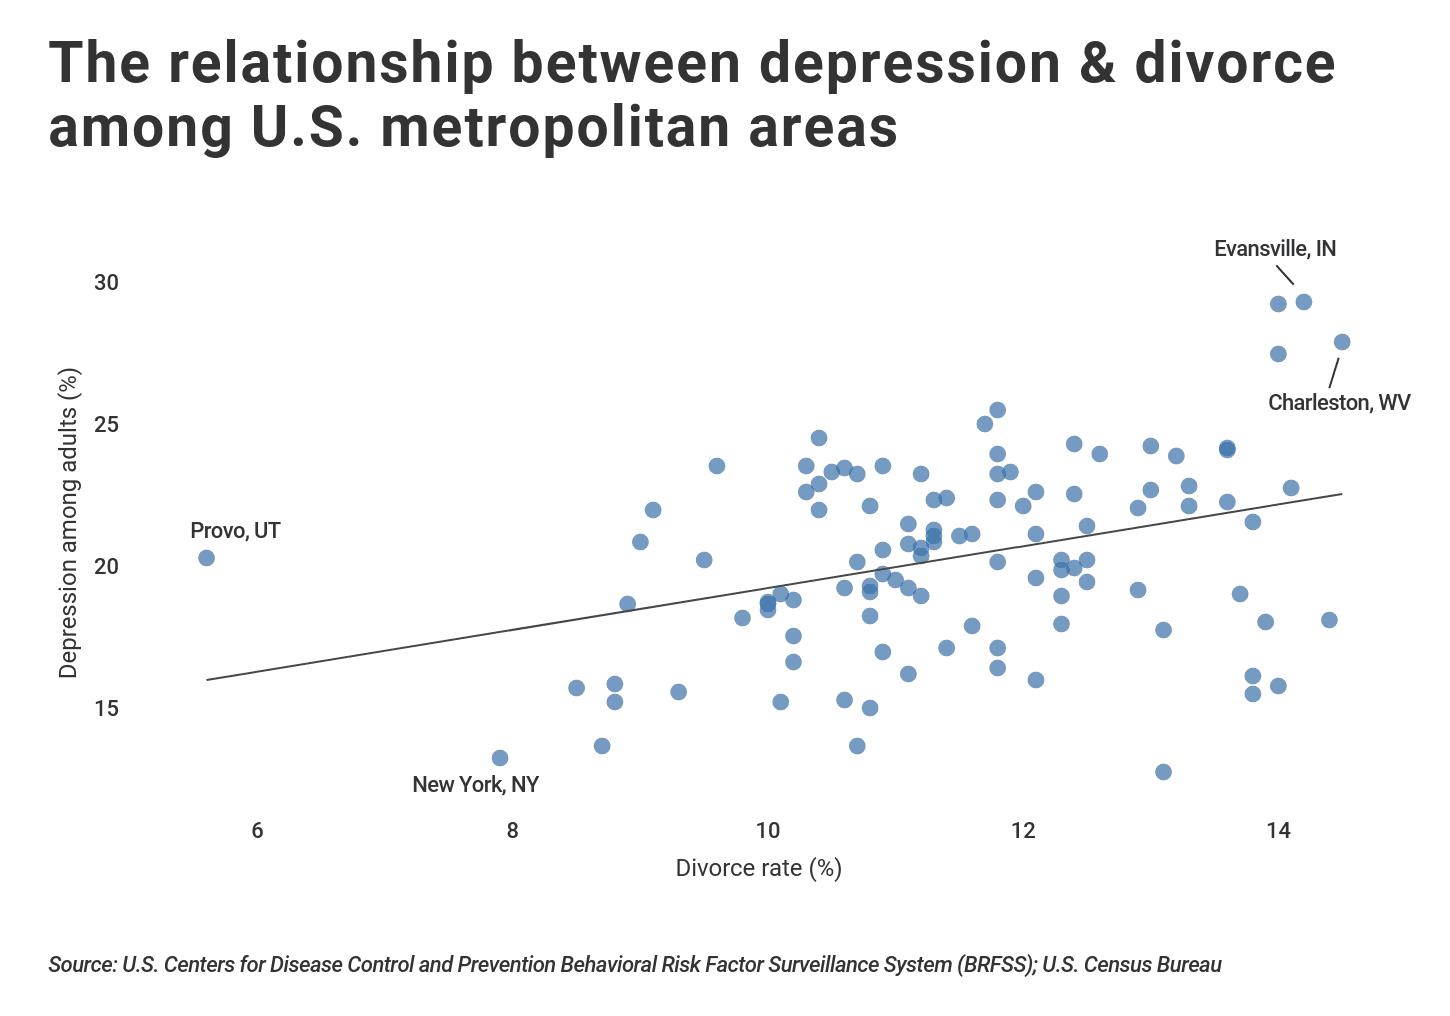
At the city level, CDC and Census data show that higher divorce rates generally correspond to higher rates of depression. However, whether people suffering from depression are at higher risks of divorce or whether divorce itself increases the risk of depression is debated in the scientific literature.
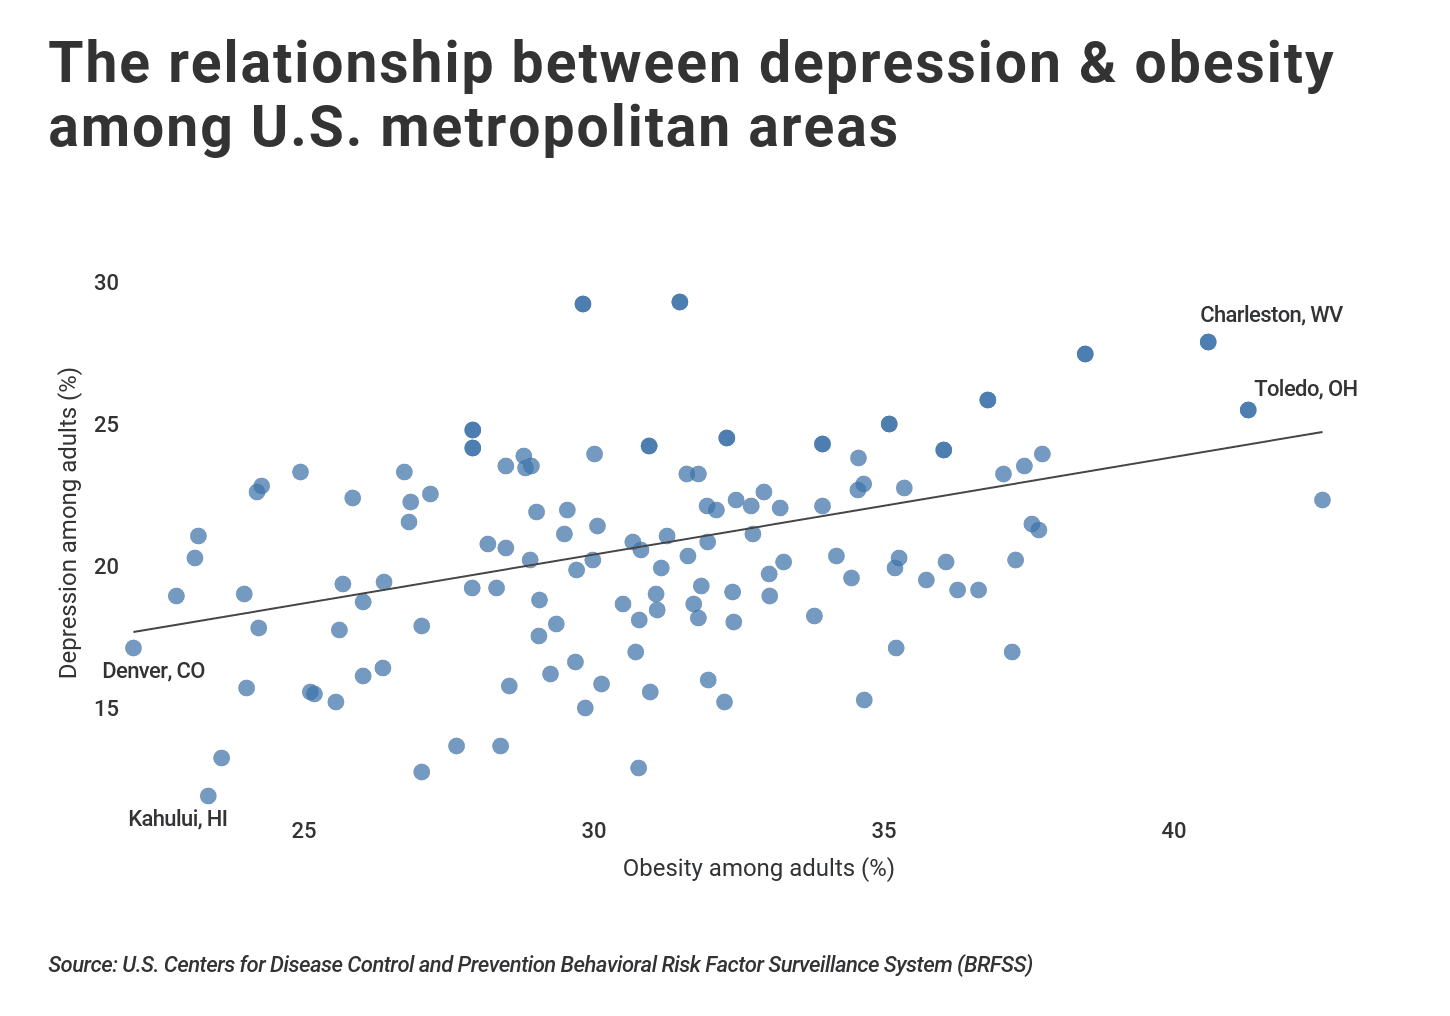
Furthermore, unchecked mental illness can directly affect physical health. Research has found that mental health diagnoses were linked to higher rates of infectious diseases, respiratory diseases, and weight gain. Among major U.S. metropolitan areas, there is a positive correlation between depression and obesity.
The relationship between depression and obesity might be mutual and even reinforcing, since physical and mental health are so closely linked. Those with depression might have difficulty exercising and maintaining a well-balanced diet, increasing the risk of obesity. At the same time, obesity itself may cause or increase the severity of depression due to the associated medical ailments, movement difficulty, and social stigma. Similar to weight gain, the stress and discomfort caused by a physical disability are strongly associated with depression.
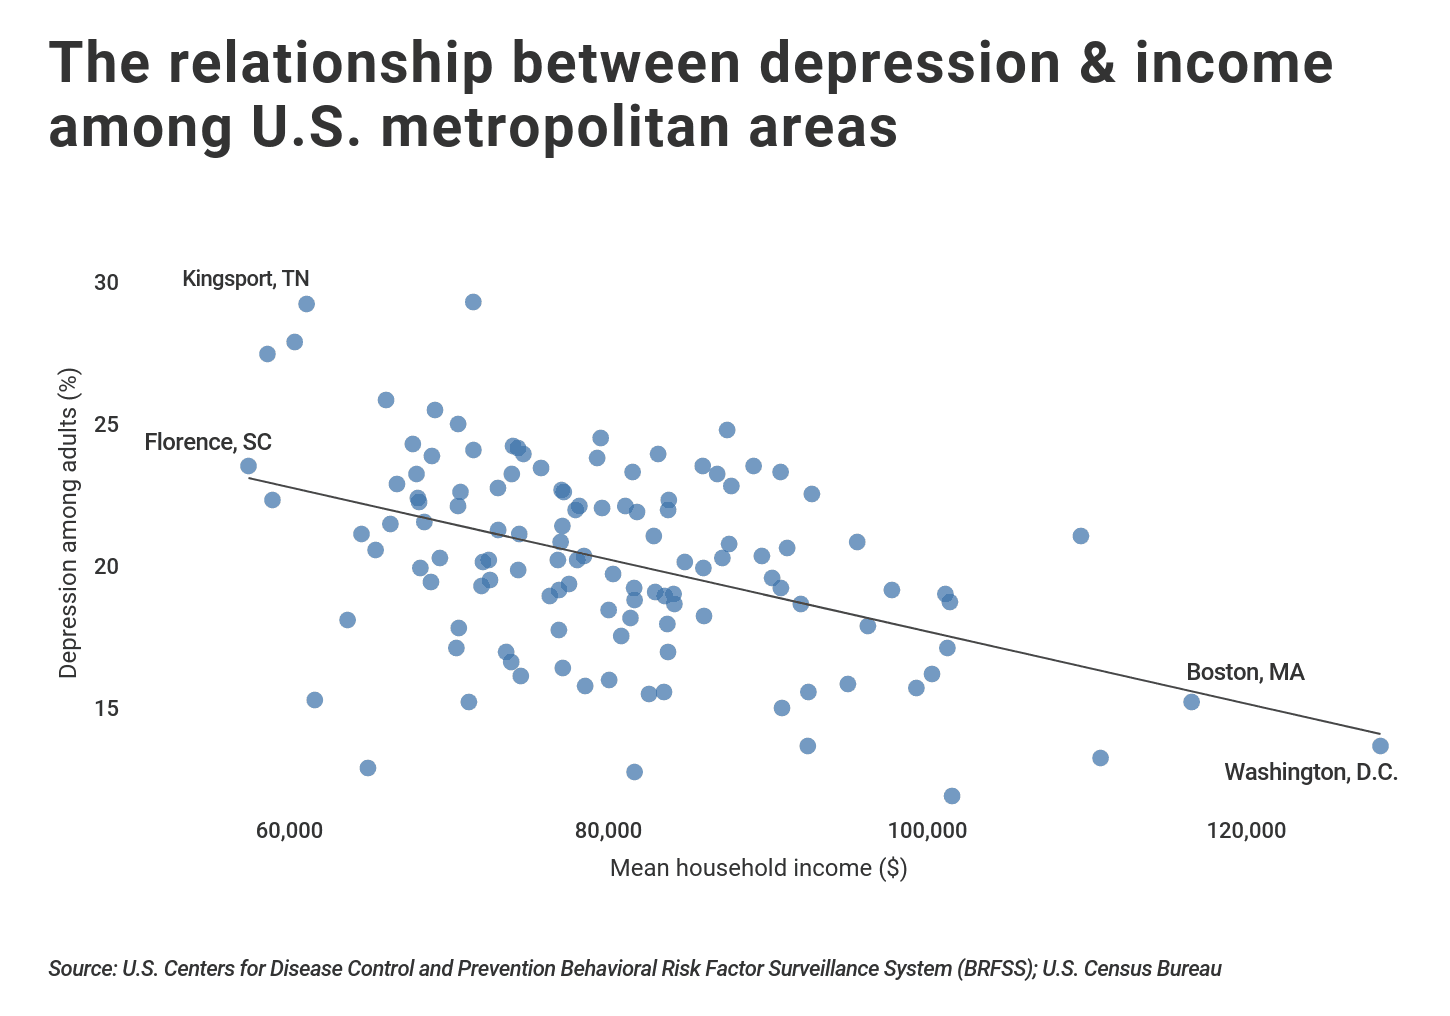
In addition to physical health, financial circumstances and mental well being are also closely intertwined. In a review of 115 studies across 33 countries, medical researchers reported that almost 80 percent of studies looking at poverty and mental illness found positive correlations. In the U.S., rates of depression are closely correlated to average household incomes across metropolitan areas.
The average household income in the U.S. is $84,525 per year, and depression tends to be more prevalent in cities with incomes below that threshold.
As with obesity, the relationship between financial health and mental health are often reinforcing. Lack of funds for rent, healthcare, or food increases stress, which triggers or exacerbates mental health issues. At the same time, depression can hinder job performance, worsening one’s financial conditions. Furthermore, low-income individuals are often unable to afford adequate mental health treatment.
Given the variation in mental health access across the country and the recent spike in depression, our researchers wanted to find cities that suffer the most from the disease. We analyzed data from the Centers for Disease and Control Prevention SMART Survey to find the percentage of adults in each metro area who have ever been diagnosed with depression. We also used data from the U.S. Census Bureau to analyze a variety of social, economic, and physical health factors associated with depression.
Here are the large metropolitan areas (1,000,000 people and above) with the highest and lowest rates of depression. For additional information on the analysis and complete results for all locations included in the CDC survey, see the Methodology section.
10 Cities with the Highest Rates of Depression

Alamy Stock Photo
#10 – Indianapolis-Carmel-Anderson, IN
- Share of adults ever diagnosed with depression: 22.6%
- Share of adults who are obese (BMI 30.0 – 99.8): 32.0%
- Share of total population with a disability: 12.4%
- Share of total population who are divorced: 12.0%
- Mean household income: $81,056
- Share of total population below poverty level: 11.9%
TRENDING
Whether you are looking for a divorce insurance, disability insurance or even life insurance with a terminal illness, InsuranceProviders.com has you covered.

Alamy Stock Photo
#9 – Columbus, OH
- Share of adults ever diagnosed with depression: 22.8%
- Share of adults who are obese (BMI 30.0 – 99.8): 32.5%
- Share of total population with a disability: 11.9%
- Share of total population who are divorced: 11.3%
- Mean household income: $83,780
- Share of total population below poverty level: 13.1%

Alamy Stock Photo
#8 – Portland-Vancouver-Hillsboro, OR-WA
- Share of adults ever diagnosed with depression: 23.1%
- Share of adults who are obese (BMI 30.0 – 99.8): 27.2%
- Share of total population with a disability: 11.8%
- Share of total population who are divorced: 12.4%
- Mean household income: $92,750
- Share of total population below poverty level: 10.9%

Alamy Stock Photo
#7 – Oklahoma City, OK
- Share of adults ever diagnosed with depression: 23.1%
- Share of adults who are obese (BMI 30.0 – 99.8): 34.6%
- Share of total population with a disability: 14.2%
- Share of total population who are divorced: 13.0%
- Mean household income: $77,056
- Share of total population below poverty level: 13.9%

Alamy Stock Photo
#6 – Providence-Warwick, RI-MA
- Share of adults ever diagnosed with depression: 23.7%
- Share of adults who are obese (BMI 30.0 – 99.8): 31.6%
- Share of total population with a disability: 13.5%
- Share of total population who are divorced: 10.7%
- Mean household income: $86,816
- Share of total population below poverty level: 11.4%

Alamy Stock Photo
#5 – Salt Lake City, UT
- Share of adults ever diagnosed with depression: 23.8%
- Share of adults who are obese (BMI 30.0 – 99.8): 24.9%
- Share of total population with a disability: 9.2%
- Share of total population who are divorced: 10.5%
- Mean household income: $90,790
- Share of total population below poverty level: 8.9%

Alamy Stock Photo
#4 – Rochester, NY
- Share of adults ever diagnosed with depression: 24.0%
- Share of adults who are obese (BMI 30.0 – 99.8): 28.8%
- Share of total population with a disability: 14.0%
- Share of total population who are divorced: 10.6%
- Mean household income: $75,771
- Share of total population below poverty level: 13.9%

Alamy Stock Photo
#3 – Birmingham-Hoover, AL
- Share of adults ever diagnosed with depression: 24.4%
- Share of adults who are obese (BMI 30.0 – 99.8): 37.7%
- Share of total population with a disability: 16.4%
- Share of total population who are divorced: 12.6%
- Mean household income: $74,667
- Share of total population below poverty level: 14.6%

Alamy Stock Photo
#2 – Cincinnati, OH-KY-IN
- Share of adults ever diagnosed with depression: 24.5%
- Share of adults who are obese (BMI 30.0 – 99.8): 30.0%
- Share of total population with a disability: 12.6%
- Share of total population who are divorced: 11.8%
- Mean household income: $83,111
- Share of total population below poverty level: 12.1%

Alamy Stock Photo
#1 – Grand Rapids-Wyoming, MI
- Share of adults ever diagnosed with depression: 25.0%
- Share of adults who are obese (BMI 30.0 – 99.8): 32.3%
- Share of total population with a disability: 11.1%
- Share of total population who are divorced: 10.4%
- Mean household income: $79,512
- Share of total population below poverty level: 10.0%
Free Health Insurance Comparison
Compare Quotes From Top Companies and Save
10 Cities with the Lowest Rates of Depression

Alamy Stock Photo
#10 – Tampa-St. Petersburg-Clearwater, FL
- Share of adults ever diagnosed with depression: 16.6%
- Share of adults who are obese (BMI 30.0 – 99.8): 26.0%
- Share of total population with a disability: 14.0%
- Share of total population who are divorced: 13.8%
- Mean household income: $74,499
- Share of total population below poverty level: 13.9%

Alamy Stock Photo
#9 – Chicago-Naperville-Elgin, IL-IN-WI
- Share of adults ever diagnosed with depression: 16.3%
- Share of adults who are obese (BMI 30.0 – 99.8): 30.1%
- Share of total population with a disability: 9.9%
- Share of total population who are divorced: 8.8%
- Mean household income: $95,010
- Share of total population below poverty level: 11.8%

Alamy Stock Photo
#8 – Los Angeles-Long Beach-Anaheim, CA
- Share of adults ever diagnosed with depression: 16.2%
- Share of adults who are obese (BMI 30.0 – 99.8): 24.0%
- Share of total population with a disability: 9.5%
- Share of total population who are divorced: 8.5%
- Mean household income: $99,303
- Share of total population below poverty level: 14.1%
WORRIED ABOUT GETTING INSURANCE?
Recently leave your job? It’s still possible to be covered by health insurance while you’re unemployed. If you’re still working but worried about affording health insurance, there are a variety of healthcare options for low-income individuals and families. If those affected are to ever invest in long-term recovery, they need to understand what treatment options are available.

Alamy Stock Photo
#7 – Houston-The Woodlands-Sugar Land, TX
- Share of adults ever diagnosed with depression: 16.1%
- Share of adults who are obese (BMI 30.0 – 99.8): 31.0%
- Share of total population with a disability: 9.2%
- Share of total population who are divorced: 9.3%
- Mean household income: $92,532
- Share of total population below poverty level: 13.9%

Alamy Stock Photo
#6 – Boston, MA
- Share of adults ever diagnosed with depression: 15.7%
- Share of adults who are obese (BMI 30.0 – 99.8): 25.6%
- Share of total population with a disability: 10.7%
- Share of total population who are divorced: 8.8%
- Mean household income: $116,561
- Share of total population below poverty level: 9.6%

Alamy Stock Photo
#5 – Atlanta-Sandy Springs-Roswell, GA
- Share of adults ever diagnosed with depression: 15.5%
- Share of adults who are obese (BMI 30.0 – 99.8): 29.9%
- Share of total population with a disability: 10.0%
- Share of total population who are divorced: 10.8%
- Mean household income: $90,879
- Share of total population below poverty level: 12.0%

Alamy Stock Photo
#4 – Dallas-Plano-Irving, TX
- Share of adults ever diagnosed with depression: 14.2%
- Share of adults who are obese (BMI 30.0 – 99.8): 28.4%
- Share of total population with a disability: 9.5%
- Share of total population who are divorced: 10.7%
- Mean household income: $92,495
- Share of total population below poverty level: 11.3%

Alamy Stock Photo
#3 – Washington-Arlington-Alexandria, DC-VA-MD-WV
- Share of adults ever diagnosed with depression: 14.2%
- Share of adults who are obese (BMI 30.0 – 99.8): 27.6%
- Share of total population with a disability: 9.0%
- Share of total population who are divorced: 8.7%
- Mean household income: $128,402
- Share of total population below poverty level: 7.9%
DID YOU KNOW?
It’s possible to still have employee-sponsored healthcare while working part-time – here are 21 employers that offer health insurance to part-time employees.

Alamy Stock Photo
#2 – New York-Jersey City-White Plains, NY-NJ
- Share of adults ever diagnosed with depression: 13.8%
- Share of adults who are obese (BMI 30.0 – 99.8): 23.6%
- Share of total population with a disability: 10.1%
- Share of total population who are divorced: 7.9%
- Mean household income: $110,849
- Share of total population below poverty level: 12.8%

Alamy Stock Photo
#1 – Miami-Fort Lauderdale-West Palm Beach, FL
- Share of adults ever diagnosed with depression: 13.3%
- Share of adults who are obese (BMI 30.0 – 99.8): 27.0%
- Share of total population with a disability: 10.9%
- Share of total population who are divorced: 13.1%
- Mean household income: $81,633
- Share of total population below poverty level: 14.3%
Methodology
Data on the share of adults who have ever been diagnosed with a form of depression comes from the Centers for Disease and Control Prevention SMART Survey (Selected Metropolitan Area Risk Trends) conducted in 2017. The SMART Survey also contains information on obesity (based on BMI) among adults as well. Additional demographic statistics—disability, marriage status, income, and poverty—are from the U.S. Census Bureau 2017 American Community Survey 1-Year Estimates. These demographic statistics are representative of the entire population, not just adults.
Metropolitan areas were grouped into the following cohorts based on population size:
- Small metros: less than 350,000
- Midsize metros: 350,000-1,000,000
- Large metros: greater than 1,000,000
Only metros with data available from the SMART Survey were included in the analysis. For a complete list of results for all locations, see the charts below.
Complete Rankings
Large Cities
| Rank | Metro | Depression Rate | Obesity Rate | Disability Rate | Divorce Rate | Mean Household Income | Poverty Rate |
|---|---|---|---|---|---|---|---|
| 1 | Grand Rapids-Wyoming, MI | 25.0% | 32.3% | 11.1% | 10.4% | $79,512 | 10.0% |
| 2 | Cincinnati, OH-KY-IN | 24.5% | 30.0% | 12.6% | 11.8% | $83,111 | 12.1% |
| 3 | Birmingham-Hoover, AL | 24.4% | 37.7% | 16.4% | 12.6% | $74,667 | 14.6% |
| 4 | Rochester, NY | 24.0% | 28.8% | 14.0% | 10.6% | $75,771 | 13.9% |
| 5 | Salt Lake City, UT | 23.8% | 24.9% | 9.2% | 10.5% | $90,790 | 8.9% |
| 6 | Providence-Warwick, RI-MA | 23.7% | 31.6% | 13.5% | 10.7% | $86,816 | 11.4% |
| 7 | Oklahoma City, OK | 23.1% | 34.6% | 14.2% | 13.0% | $77,056 | 13.9% |
| 8 | Portland-Vancouver-Hillsboro, OR-WA | 23.1% | 27.2% | 11.8% | 12.4% | $92,750 | 10.9% |
| 9 | Columbus, OH | 22.8% | 32.5% | 11.9% | 11.3% | $83,780 | 13.1% |
| 10 | Indianapolis-Carmel-Anderson, IN | 22.6% | 32.0% | 12.4% | 12.0% | $81,056 | 11.9% |
| 11 | Jacksonville, FL | 22.5% | 33.2% | 13.5% | 12.9% | $79,596 | 13.3% |
| 12 | Louisville/Jefferson County, KY-IN | 21.9% | 30.1% | 14.1% | 12.5% | $77,113 | 12.2% |
| 13 | Cleveland-Elyria, OH | 21.6% | 32.7% | 14.5% | 12.1% | $74,406 | 14.8% |
| 14 | St. Louis, MO-IL | 21.6% | 31.3% | 13.1% | 11.5% | $82,841 | 11.6% |
| 15 | Seattle-Bellevue-Everett, WA | 21.6% | 23.2% | 11.1% | 11.3% | $109,619 | 9.0% |
| 16 | San Antonio-New Braunfels, TX | 21.4% | 30.7% | 14.6% | 11.3% | $77,001 | 14.5% |
| 17 | Philadelphia, PA | 21.3% | 32.0% | 12.3% | 9.0% | $95,595 | 12.8% |
| 18 | Nashville-Davidson--Murfreesboro--Franklin, TN | 21.2% | 28.2% | 12.0% | 11.1% | $87,562 | 10.9% |
| 19 | Richmond, VA | 20.8% | 31.6% | 12.3% | 11.2% | $89,615 | 11.2% |
| 20 | New Orleans-Metairie, LA | 20.7% | 36.1% | 14.1% | 11.8% | $72,130 | 18.6% |
| 21 | Kansas City, MO-KS | 20.5% | 31.2% | 12.0% | 12.4% | $85,949 | 10.0% |
| 22 | Warren-Troy Farmington Hills, MI (2012 to present) | 19.8% | 28.3% | 13.7% | 11.1% | $81,606 | 14.6% |
| 23 | Sacramento--Roseville--Arden-Arcade, CA | 19.7% | 27.9% | 11.5% | 10.6% | $90,806 | 13.1% |
| 24 | Virginia Beach-Norfolk-Newport News, VA-NC | 19.6% | 32.4% | 14.3% | 10.8% | $82,927 | 12.3% |
| 25 | Baltimore-Columbia-Towson, MD | 19.5% | 31.1% | 11.6% | 10.1% | $101,124 | 10.2% |
| 26 | Milwaukee-Waukesha-West Allis, WI | 19.3% | 29.1% | 11.0% | 10.2% | $81,635 | 13.3% |
| 27 | Minneapolis-St. Paul-Bloomington, MN-WI | 19.2% | 26.0% | 10.1% | 10.0% | $101,405 | 8.1% |
| 28 | Pittsburgh, PA | 18.9% | 31.1% | 14.8% | 10.0% | $80,012 | 11.0% |
| 29 | Charlotte-Concord-Gastonia, NC-SC | 18.8% | 33.8% | 10.3% | 10.8% | $85,987 | 12.1% |
| 30 | Riverside-San Bernardino-Ontario, CA | 18.7% | 31.8% | 11.6% | 9.8% | $81,378 | 14.4% |
| 31 | San Juan-Carolina-Caguas, PR | 18.5% | 32.4% | 21.4% | 13.9% | $34,934 | 39.8% |
| 32 | Phoenix-Mesa-Scottsdale, AZ | 18.5% | 29.4% | 11.5% | 12.3% | $83,688 | 13.3% |
| 33 | Hartford-West Hartford-East Hartford, CT | 18.4% | 27.0% | 11.5% | 11.6% | $96,260 | 10.0% |
| 34 | Denver-Aurora-Lakewood, CO | 17.6% | 22.1% | 9.6% | 11.8% | $101,249 | 8.6% |
| 35 | Memphis, TN-MS-AR | 17.5% | 37.2% | 13.0% | 10.9% | $73,581 | 17.1% |
| 36 | Buffalo-Cheektowaga-Niagara Falls, NY | 17.1% | 29.7% | 13.3% | 10.2% | $73,903 | 14.2% |
| 37 | Orlando-Kissimmee-Sanford, FL | 16.9% | 26.4% | 12.0% | 11.8% | $77,135 | 14.1% |
| 38 | Austin-Round Rock, TX | 16.7% | 29.3% | 8.9% | 11.1% | $100,282 | 10.4% |
| 39 | Tampa-St. Petersburg-Clearwater, FL | 16.6% | 26.0% | 14.0% | 13.8% | $74,499 | 13.9% |
| 40 | Chicago-Naperville-Elgin, IL-IN-WI | 16.3% | 30.1% | 9.9% | 8.8% | $95,010 | 11.8% |
| 41 | Los Angeles-Long Beach-Anaheim, CA | 16.2% | 24.0% | 9.5% | 8.5% | $99,303 | 14.1% |
| 42 | Houston-The Woodlands-Sugar Land, TX | 16.1% | 31.0% | 9.2% | 9.3% | $92,532 | 13.9% |
| 43 | Boston, MA | 15.7% | 25.6% | 10.7% | 8.8% | $116,561 | 9.6% |
| 44 | Atlanta-Sandy Springs-Roswell, GA | 15.5% | 29.9% | 10.0% | 10.8% | $90,879 | 12.0% |
| 45 | Dallas-Plano-Irving, TX | 14.2% | 28.4% | 9.5% | 10.7% | $92,495 | 11.3% |
| 46 | Washington-Arlington-Alexandria, DC-VA-MD-WV | 14.2% | 27.6% | 9.0% | 8.7% | $128,402 | 7.9% |
| 47 | New York-Jersey City-White Plains, NY-NJ | 13.8% | 23.6% | 10.1% | 7.9% | $110,849 | 12.8% |
| 48 | Miami-Fort Lauderdale-West Palm Beach, FL | 13.3% | 27.0% | 10.9% | 13.1% | $81,633 | 14.3% |
Midsize Cities
| Rank | Metro | Depression Rate | Obesity Rate | Disability Rate | Divorce Rate | Mean Household Income | Poverty Rate |
|---|---|---|---|---|---|---|---|
| 1 | Huntington-Ashland, WV-KY-OH | 28.0% | 38.5% | 21.1% | 14.0% | $58,619 | 20.9% |
| 2 | Toledo, OH | 26.0% | 41.3% | 14.4% | 11.8% | $69,121 | 15.9% |
| 3 | Dayton, OH | 25.5% | 35.1% | 14.7% | 11.7% | $70,571 | 13.8% |
| 4 | Fort Wayne, IN | 24.7% | 33.9% | 12.7% | 12.4% | $67,732 | 12.3% |
| 5 | Knoxville, TN | 24.7% | 31.0% | 14.9% | 13.0% | $74,016 | 14.3% |
| 6 | Spokane-Spokane Valley, WA | 24.6% | 27.9% | 14.1% | 13.6% | $74,322 | 14.0% |
| 7 | Tulsa, OK | 24.6% | 36.0% | 14.7% | 13.6% | $71,534 | 14.3% |
| 8 | Pensacola-Ferry Pass-Brent, FL | 24.3% | 28.8% | 16.3% | 13.2% | $68,929 | 13.7% |
| 9 | Ogden-Clearfield, UT | 24.0% | 28.9% | 10.6% | 9.6% | $85,908 | 7.4% |
| 10 | Albany-Schenectady-Troy, NY | 24.0% | 28.5% | 12.8% | 10.9% | $89,097 | 10.4% |
| 11 | Lansing-East Lansing, MI | 23.7% | 31.8% | 14.0% | 11.2% | $73,938 | 15.3% |
| 12 | Portland-South Portland, ME | 23.3% | 24.3% | 13.0% | 13.3% | $87,700 | 7.8% |
| 13 | Little Rock-North Little Rock-Conway, AR | 23.3% | 35.4% | 16.9% | 14.1% | $73,068 | 13.0% |
| 14 | Springfield, MA | 23.1% | 24.2% | 15.9% | 10.3% | $77,195 | 15.5% |
| 15 | Rockingham County-Strafford County, NH | 22.9% | 25.8% | 12.4% | 11.4% | $68,047 | 15.1% |
| 16 | Wichita, KS | 22.6% | 33.9% | 14.4% | 13.3% | $70,563 | 13.4% |
| 17 | Fayetteville-Springdale-Rogers, AR-MO | 22.6% | 32.7% | 10.4% | 10.8% | $78,173 | 12.1% |
| 18 | Charleston-North Charleston, SC | 22.5% | 32.1% | 11.4% | 10.4% | $83,736 | 11.9% |
| 19 | Albuquerque, NM | 22.0% | 26.8% | 15.0% | 13.8% | $68,453 | 15.5% |
| 20 | Augusta-Richmond County, GA-SC | 22.0% | 37.6% | 14.7% | 11.1% | $66,326 | 15.5% |
| 21 | Myrtle Beach-Conway-North Myrtle Beach, SC-NC | 21.6% | 29.5% | 16.7% | 11.6% | $64,514 | 15.3% |
| 22 | Worcester, MA-CT | 21.1% | 28.5% | 12.6% | 11.2% | $91,200 | 10.6% |
| 23 | Provo-Orem, UT | 20.8% | 23.1% | 7.7% | 5.6% | $87,138 | 10.6% |
| 24 | Boise City, ID | 20.7% | 30.0% | 12.2% | 12.5% | $76,825 | 12.9% |
| 25 | Corpus Christi, TX | 20.7% | 37.3% | 14.2% | 12.3% | $72,496 | 16.6% |
| 26 | Omaha-Council Bluffs, NE-IA | 20.6% | 33.3% | 11.6% | 10.7% | $84,781 | 9.6% |
| 27 | Salisbury, MD-DE | 20.2% | 33.0% | 14.2% | 10.9% | $80,287 | 12.6% |
| 28 | Des Moines-West Des Moines, IA | 20.1% | 34.4% | 10.4% | 12.1% | $90,259 | 8.3% |
| 29 | Columbia, SC | 20.0% | 35.7% | 14.0% | 11.0% | $72,572 | 15.1% |
| 30 | Greenville-Anderson-Mauldin, SC | 19.8% | 31.9% | 14.8% | 10.8% | $72,038 | 14.2% |
| 31 | Anchorage, AK | 19.6% | 36.3% | 12.3% | 12.9% | $97,769 | 10.4% |
| 32 | Reno, NV | 19.5% | 24.0% | 11.3% | 13.7% | $84,079 | 10.8% |
| 33 | Colorado Springs, CO | 19.5% | 22.8% | 13.0% | 12.3% | $83,525 | 10.7% |
| 34 | Baton Rouge, LA | 19.4% | 33.0% | 13.9% | 11.2% | $76,318 | 16.3% |
| 35 | Allentown-Bethlehem-Easton, PA-NJ | 19.2% | 31.7% | 13.1% | 10.0% | $84,133 | 11.2% |
| 36 | Deltona-Daytona Beach-Ormond Beach, FL | 18.6% | 30.8% | 17.4% | 14.4% | $63,640 | 15.0% |
| 37 | Port St. Lucie, FL | 18.3% | 25.6% | 15.5% | 13.1% | $76,888 | 11.4% |
| 38 | Jackson, MS | 17.6% | 35.2% | 11.6% | 11.4% | $70,461 | 15.4% |
| 39 | Lexington-Fayette, KY | 16.5% | 32.0% | 13.8% | 12.1% | $80,041 | 15.8% |
| 40 | North Port-Sarasota-Bradenton, FL | 16.0% | 25.2% | 14.7% | 13.8% | $82,540 | 9.5% |
| 41 | El Paso, TX | 15.8% | 34.7% | 12.1% | 10.6% | $61,583 | 21.1% |
| 42 | Tallahassee, FL | 15.7% | 32.3% | 12.9% | 10.1% | $71,247 | 18.2% |
Small Cities
| Rank | Metro | Depression Rate | Obesity Rate | Disability Rate | Divorce Rate | Mean Household Income | Poverty Rate |
|---|---|---|---|---|---|---|---|
| 1 | Evansville, IN-KY | 29.8% | 31.5% | 15.4% | 14.2% | $71,523 | 15.0% |
| 2 | Kingsport-Bristol-Bristol, TN-VA | 29.7% | 29.8% | 20.9% | 14.0% | $61,070 | 15.3% |
| 3 | Charleston, WV | 28.4% | 40.6% | 19.4% | 14.5% | $60,327 | 19.0% |
| 4 | Tuscaloosa, AL | 26.3% | 36.8% | 13.4% | $66,054 | 16.3% | |
| 5 | Burlington-South Burlington, VT | 25.3% | 27.9% | 12.0% | $87,439 | 11.3% | |
| 6 | Minot, ND | 24.3% | 34.6% | 9.9% | $79,289 | 10.5% | |
| 7 | Florence, SC | 24.0% | 37.4% | 18.0% | 10.3% | $57,430 | 19.3% |
| 8 | Claremont-Lebanon, NH-VT | 23.8% | 26.7% | 15.0% | 11.9% | $81,513 | 10.1% |
| 9 | Topeka, KS | 23.7% | 37.1% | 13.1% | 11.8% | $67,963 | 10.9% |
| 10 | Spartanburg, SC | 23.4% | 34.7% | 15.7% | 10.4% | $66,737 | 13.7% |
| 11 | South Bend-Mishawaka, IN-MI | 23.1% | 32.9% | 14.5% | 12.1% | $70,720 | 15.0% |
| 12 | Wichita Falls, TX | 22.8% | 42.6% | 17.2% | 11.8% | $58,933 | 16.2% |
| 13 | Panama City, FL | 22.8% | 26.8% | 20.1% | 13.6% | $68,124 | 15.5% |
| 14 | St. Cloud, MN | 22.5% | 29.5% | 11.1% | 9.1% | $77,934 | 11.1% |
| 15 | Fargo, ND-MN | 22.4% | 29.0% | 8.4% | $81,787 | 9.7% | |
| 16 | Hagerstown-Martinsburg, MD-WV | 21.7% | 37.7% | 15.9% | 11.3% | $73,082 | 13.4% |
| 17 | Gainesville, FL | 21.0% | 30.8% | 11.6% | 10.9% | $65,397 | 21.2% |
| 18 | Cedar Rapids, IA | 20.8% | 34.2% | 8.6% | $78,464 | 8.7% | |
| 19 | Rapid City, SD | 20.8% | 35.3% | 13.2% | $69,430 | 11.8% | |
| 20 | Lincoln, NE | 20.7% | 28.9% | 10.3% | 9.5% | $78,036 | 11.2% |
| 21 | Grand Forks, ND-MN | 20.4% | 35.2% | 10.6% | $68,203 | 15.5% | |
| 22 | Sioux City, IA-NE-SD | 20.4% | 29.7% | 12.6% | 12.3% | $74,337 | 12.2% |
| 23 | Duluth, MN-WI | 19.9% | 26.4% | 14.5% | 12.5% | $68,868 | 13.6% |
| 24 | Billings, MT | 19.9% | 25.7% | 11.9% | $77,523 | 9.7% | |
| 25 | Grand Island, NE | 19.7% | 36.6% | 12.4% | $76,901 | 10.3% | |
| 26 | Rochester, MN | 19.2% | 30.5% | 11.7% | 8.9% | $92,058 | 8.3% |
| 27 | Manhattan, KS | 18.3% | 24.2% | 10.6% | $70,613 | 20.1% | |
| 28 | Sioux Falls, SD | 18.0% | 29.1% | 9.2% | 10.2% | $80,800 | 6.8% |
| 29 | Bismarck, ND | 17.5% | 30.7% | 9.3% | $83,730 | 9.1% | |
| 30 | Crestview-Fort Walton Beach-Destin, FL | 16.3% | 28.5% | 17.4% | 14.0% | $78,536 | 13.2% |
| 31 | Hilton Head Island-Bluffton-Beaufort, SC | 16.1% | 25.1% | 15.1% | $83,477 | 10.9% | |
| 32 | College Station-Bryan, TX | 13.4% | 30.8% | 9.4% | $64,918 | 24.6% | |
| 33 | Kahului-Wailuku-Lahaina, HI | 12.4% | 23.4% | 9.7% | $101,541 | 9.7% |
All Metros Areas
| Rank | Metro | Depression Rate | Obesity Rate | Disability Rate | Divorce Rate | Mean Household Income | Poverty Rate |
|---|---|---|---|---|---|---|---|
| 1 | Evansville, IN-KY | 29.8% | 31.5% | 15.4% | 14.2% | $71,523 | 15.0% |
| 2 | Kingsport-Bristol-Bristol, TN-VA | 29.7% | 29.8% | 20.9% | 14.0% | $61,070 | 15.3% |
| 3 | Charleston, WV | 28.4% | 40.6% | 19.4% | 14.5% | $60,327 | 19.0% |
| 4 | Huntington-Ashland, WV-KY-OH | 28.0% | 38.5% | 21.1% | 14.0% | $58,619 | 20.9% |
| 5 | Tuscaloosa, AL | 26.3% | 36.8% | 13.4% | $66,054 | 16.3% | |
| 6 | Toledo, OH | 26.0% | 41.3% | 14.4% | 11.8% | $69,121 | 15.9% |
| 7 | Dayton, OH | 25.5% | 35.1% | 14.7% | 11.7% | $70,571 | 13.8% |
| 8 | Burlington-South Burlington, VT | 25.3% | 27.9% | 12.0% | $87,439 | 11.3% | |
| 9 | Grand Rapids-Wyoming, MI | 25.0% | 32.3% | 11.1% | 10.4% | $79,512 | 10.0% |
| 10 | Fort Wayne, IN | 24.7% | 33.9% | 12.7% | 12.4% | $67,732 | 12.3% |
| 11 | Knoxville, TN | 24.7% | 31.0% | 14.9% | 13.0% | $74,016 | 14.3% |
| 12 | Spokane-Spokane Valley, WA | 24.6% | 27.9% | 14.1% | 13.6% | $74,322 | 14.0% |
| 13 | Tulsa, OK | 24.6% | 36.0% | 14.7% | 13.6% | $71,534 | 14.3% |
| 14 | Cincinnati, OH-KY-IN | 24.5% | 30.0% | 12.6% | 11.8% | $83,111 | 12.1% |
| 15 | Birmingham-Hoover, AL | 24.4% | 37.7% | 16.4% | 12.6% | $74,667 | 14.6% |
| 16 | Pensacola-Ferry Pass-Brent, FL | 24.3% | 28.8% | 16.3% | 13.2% | $68,929 | 13.7% |
| 17 | Minot, ND | 24.3% | 34.6% | 9.9% | $79,289 | 10.5% | |
| 18 | Ogden-Clearfield, UT | 24.0% | 28.9% | 10.6% | 9.6% | $85,908 | 7.4% |
| 19 | Florence, SC | 24.0% | 37.4% | 18.0% | 10.3% | $57,430 | 19.3% |
| 20 | Albany-Schenectady-Troy, NY | 24.0% | 28.5% | 12.8% | 10.9% | $89,097 | 10.4% |
| 21 | Rochester, NY | 24.0% | 28.8% | 14.0% | 10.6% | $75,771 | 13.9% |
| 22 | Claremont-Lebanon, NH-VT | 23.8% | 26.7% | 15.0% | 11.9% | $81,513 | 10.1% |
| 23 | Salt Lake City, UT | 23.8% | 24.9% | 9.2% | 10.5% | $90,790 | 8.9% |
| 24 | Topeka, KS | 23.7% | 37.1% | 13.1% | 11.8% | $67,963 | 10.9% |
| 25 | Lansing-East Lansing, MI | 23.7% | 31.8% | 14.0% | 11.2% | $73,938 | 15.3% |
| 26 | Providence-Warwick, RI-MA | 23.7% | 31.6% | 13.5% | 10.7% | $86,816 | 11.4% |
| 27 | Spartanburg, SC | 23.4% | 34.7% | 15.7% | 10.4% | $66,737 | 13.7% |
| 28 | Portland-South Portland, ME | 23.3% | 24.3% | 13.0% | 13.3% | $87,700 | 7.8% |
| 29 | Little Rock-North Little Rock-Conway, AR | 23.3% | 35.4% | 16.9% | 14.1% | $73,068 | 13.0% |
| 30 | Oklahoma City, OK | 23.1% | 34.6% | 14.2% | 13.0% | $77,056 | 13.9% |
| 31 | Springfield, MA | 23.1% | 24.2% | 15.9% | 10.3% | $77,195 | 15.5% |
| 32 | South Bend-Mishawaka, IN-MI | 23.1% | 32.9% | 14.5% | 12.1% | $70,720 | 15.0% |
| 33 | Portland-Vancouver-Hillsboro, OR-WA | 23.1% | 27.2% | 11.8% | 12.4% | $92,750 | 10.9% |
| 34 | Rockingham County-Strafford County, NH | 22.9% | 25.8% | 12.4% | 11.4% | $68,047 | 15.1% |
| 35 | Wichita Falls, TX | 22.8% | 42.6% | 17.2% | 11.8% | $58,933 | 16.2% |
| 36 | Columbus, OH | 22.8% | 32.5% | 11.9% | 11.3% | $83,780 | 13.1% |
| 37 | Panama City, FL | 22.8% | 26.8% | 20.1% | 13.6% | $68,124 | 15.5% |
| 38 | Wichita, KS | 22.6% | 33.9% | 14.4% | 13.3% | $70,563 | 13.4% |
| 39 | Fayetteville-Springdale-Rogers, AR-MO | 22.6% | 32.7% | 10.4% | 10.8% | $78,173 | 12.1% |
| 40 | Indianapolis-Carmel-Anderson, IN | 22.6% | 32.0% | 12.4% | 12.0% | $81,056 | 11.9% |
| 41 | Jacksonville, FL | 22.5% | 33.2% | 13.5% | 12.9% | $79,596 | 13.3% |
| 42 | Charleston-North Charleston, SC | 22.5% | 32.1% | 11.4% | 10.4% | $83,736 | 11.9% |
| 43 | St. Cloud, MN | 22.5% | 29.5% | 11.1% | 9.1% | $77,934 | 11.1% |
| 44 | Fargo, ND-MN | 22.4% | 29.0% | 8.4% | $81,787 | 9.7% | |
| 45 | Albuquerque, NM | 22.0% | 26.8% | 15.0% | 13.8% | $68,453 | 15.5% |
| 46 | Augusta-Richmond County, GA-SC | 22.0% | 37.6% | 14.7% | 11.1% | $66,326 | 15.5% |
| 47 | Louisville/Jefferson County, KY-IN | 21.9% | 30.1% | 14.1% | 12.5% | $77,113 | 12.2% |
| 48 | Hagerstown-Martinsburg, MD-WV | 21.7% | 37.7% | 15.9% | 11.3% | $73,082 | 13.4% |
| 49 | Cleveland-Elyria, OH | 21.6% | 32.7% | 14.5% | 12.1% | $74,406 | 14.8% |
| 50 | Myrtle Beach-Conway-North Myrtle Beach, SC-NC | 21.6% | 29.5% | 16.7% | 11.6% | $64,514 | 15.3% |
| 51 | St. Louis, MO-IL | 21.6% | 31.3% | 13.1% | 11.5% | $82,841 | 11.6% |
| 52 | Seattle-Bellevue-Everett, WA | 21.6% | 23.2% | 11.1% | 11.3% | $109,619 | 9.0% |
| 53 | San Antonio-New Braunfels, TX | 21.4% | 30.7% | 14.6% | 11.3% | $77,001 | 14.5% |
| 54 | Philadelphia, PA | 21.3% | 32.0% | 12.3% | 9.0% | $95,595 | 12.8% |
| 55 | Nashville-Davidson--Murfreesboro--Franklin, TN | 21.2% | 28.2% | 12.0% | 11.1% | $87,562 | 10.9% |
| 56 | Worcester, MA-CT | 21.1% | 28.5% | 12.6% | 11.2% | $91,200 | 10.6% |
| 57 | Gainesville, FL | 21.0% | 30.8% | 11.6% | 10.9% | $65,397 | 21.2% |
| 58 | Richmond, VA | 20.8% | 31.6% | 12.3% | 11.2% | $89,615 | 11.2% |
| 59 | Cedar Rapids, IA | 20.8% | 34.2% | 8.6% | $78,464 | 8.7% | |
| 60 | Rapid City, SD | 20.8% | 35.3% | 13.2% | $69,430 | 11.8% | |
| 61 | Provo-Orem, UT | 20.8% | 23.1% | 7.7% | 5.6% | $87,138 | 10.6% |
| 62 | Boise City, ID | 20.7% | 30.0% | 12.2% | 12.5% | $76,825 | 12.9% |
| 63 | Lincoln, NE | 20.7% | 28.9% | 10.3% | 9.5% | $78,036 | 11.2% |
| 64 | Corpus Christi, TX | 20.7% | 37.3% | 14.2% | 12.3% | $72,496 | 16.6% |
| 65 | New Orleans-Metairie, LA | 20.7% | 36.1% | 14.1% | 11.8% | $72,130 | 18.6% |
| 66 | Omaha-Council Bluffs, NE-IA | 20.6% | 33.3% | 11.6% | 10.7% | $84,781 | 9.6% |
| 67 | Kansas City, MO-KS | 20.5% | 31.2% | 12.0% | 12.4% | $85,949 | 10.0% |
| 68 | Grand Forks, ND-MN | 20.4% | 35.2% | 10.6% | $68,203 | 15.5% | |
| 69 | Sioux City, IA-NE-SD | 20.4% | 29.7% | 12.6% | 12.3% | $74,337 | 12.2% |
| 70 | Salisbury, MD-DE | 20.2% | 33.0% | 14.2% | 10.9% | $80,287 | 12.6% |
| 71 | Des Moines-West Des Moines, IA | 20.1% | 34.4% | 10.4% | 12.1% | $90,259 | 8.3% |
| 72 | Columbia, SC | 20.0% | 35.7% | 14.0% | 11.0% | $72,572 | 15.1% |
| 73 | Duluth, MN-WI | 19.9% | 26.4% | 14.5% | 12.5% | $68,868 | 13.6% |
| 74 | Billings, MT | 19.9% | 25.7% | 11.9% | $77,523 | 9.7% | |
| 75 | Greenville-Anderson-Mauldin, SC | 19.8% | 31.9% | 14.8% | 10.8% | $72,038 | 14.2% |
| 76 | Warren-Troy Farmington Hills, MI (2012 to present) | 19.8% | 28.3% | 13.7% | 11.1% | $81,606 | 14.6% |
| 77 | Sacramento--Roseville--Arden-Arcade, CA | 19.7% | 27.9% | 11.5% | 10.6% | $90,806 | 13.1% |
| 78 | Grand Island, NE | 19.7% | 36.6% | 12.4% | $76,901 | 10.3% | |
| 79 | Anchorage, AK | 19.6% | 36.3% | 12.3% | 12.9% | $97,769 | 10.4% |
| 80 | Virginia Beach-Norfolk-Newport News, VA-NC | 19.6% | 32.4% | 14.3% | 10.8% | $82,927 | 12.3% |
| 81 | Reno, NV | 19.5% | 24.0% | 11.3% | 13.7% | $84,079 | 10.8% |
| 82 | Baltimore-Columbia-Towson, MD | 19.5% | 31.1% | 11.6% | 10.1% | $101,124 | 10.2% |
| 83 | Colorado Springs, CO | 19.5% | 22.8% | 13.0% | 12.3% | $83,525 | 10.7% |
| 84 | Baton Rouge, LA | 19.4% | 33.0% | 13.9% | 11.2% | $76,318 | 16.3% |
| 85 | Milwaukee-Waukesha-West Allis, WI | 19.3% | 29.1% | 11.0% | 10.2% | $81,635 | 13.3% |
| 86 | Minneapolis-St. Paul-Bloomington, MN-WI | 19.2% | 26.0% | 10.1% | 10.0% | $101,405 | 8.1% |
| 87 | Allentown-Bethlehem-Easton, PA-NJ | 19.2% | 31.7% | 13.1% | 10.0% | $84,133 | 11.2% |
| 88 | Rochester, MN | 19.2% | 30.5% | 11.7% | 8.9% | $92,058 | 8.3% |
| 89 | Pittsburgh, PA | 18.9% | 31.1% | 14.8% | 10.0% | $80,012 | 11.0% |
| 90 | Charlotte-Concord-Gastonia, NC-SC | 18.8% | 33.8% | 10.3% | 10.8% | $85,987 | 12.1% |
| 91 | Riverside-San Bernardino-Ontario, CA | 18.7% | 31.8% | 11.6% | 9.8% | $81,378 | 14.4% |
| 92 | Deltona-Daytona Beach-Ormond Beach, FL | 18.6% | 30.8% | 17.4% | 14.4% | $63,640 | 15.0% |
| 93 | San Juan-Carolina-Caguas, PR | 18.5% | 32.4% | 21.4% | 13.9% | $34,934 | 39.8% |
| 94 | Phoenix-Mesa-Scottsdale, AZ | 18.5% | 29.4% | 11.5% | 12.3% | $83,688 | 13.3% |
| 95 | Hartford-West Hartford-East Hartford, CT | 18.4% | 27.0% | 11.5% | 11.6% | $96,260 | 10.0% |
| 96 | Manhattan, KS | 18.3% | 24.2% | 10.6% | $70,613 | 20.1% | |
| 97 | Port St. Lucie, FL | 18.3% | 25.6% | 15.5% | 13.1% | $76,888 | 11.4% |
| 98 | Sioux Falls, SD | 18.0% | 29.1% | 9.2% | 10.2% | $80,800 | 6.8% |
| 99 | Denver-Aurora-Lakewood, CO | 17.6% | 22.1% | 9.6% | 11.8% | $101,249 | 8.6% |
| 100 | Jackson, MS | 17.6% | 35.2% | 11.6% | 11.4% | $70,461 | 15.4% |
| 101 | Bismarck, ND | 17.5% | 30.7% | 9.3% | $83,730 | 9.1% | |
| 102 | Memphis, TN-MS-AR | 17.5% | 37.2% | 13.0% | 10.9% | $73,581 | 17.1% |
| 103 | Buffalo-Cheektowaga-Niagara Falls, NY | 17.1% | 29.7% | 13.3% | 10.2% | $73,903 | 14.2% |
| 104 | Orlando-Kissimmee-Sanford, FL | 16.9% | 26.4% | 12.0% | 11.8% | $77,135 | 14.1% |
| 105 | Austin-Round Rock, TX | 16.7% | 29.3% | 8.9% | 11.1% | $100,282 | 10.4% |
| 106 | Tampa-St. Petersburg-Clearwater, FL | 16.6% | 26.0% | 14.0% | 13.8% | $74,499 | 13.9% |
| 107 | Lexington-Fayette, KY | 16.5% | 32.0% | 13.8% | 12.1% | $80,041 | 15.8% |
| 108 | Chicago-Naperville-Elgin, IL-IN-WI | 16.3% | 30.1% | 9.9% | 8.8% | $95,010 | 11.8% |
| 109 | Crestview-Fort Walton Beach-Destin, FL | 16.3% | 28.5% | 17.4% | 14.0% | $78,536 | 13.2% |
| 110 | Los Angeles-Long Beach-Anaheim, CA | 16.2% | 24.0% | 9.5% | 8.5% | $99,303 | 14.1% |
| 111 | Hilton Head Island-Bluffton-Beaufort, SC | 16.1% | 25.1% | 15.1% | $83,477 | 10.9% | |
| 112 | Houston-The Woodlands-Sugar Land, TX | 16.1% | 31.0% | 9.2% | 9.3% | $92,532 | 13.9% |
| 113 | North Port-Sarasota-Bradenton, FL | 16.0% | 25.2% | 14.7% | 13.8% | $82,540 | 9.5% |
| 114 | El Paso, TX | 15.8% | 34.7% | 12.1% | 10.6% | $61,583 | 21.1% |
| 115 | Tallahassee, FL | 15.7% | 32.3% | 12.9% | 10.1% | $71,247 | 18.2% |
| 116 | Boston, MA | 15.7% | 25.6% | 10.7% | 8.8% | $116,561 | 9.6% |
| 117 | Atlanta-Sandy Springs-Roswell, GA | 15.5% | 29.9% | 10.0% | 10.8% | $90,879 | 12.0% |
| 118 | Dallas-Plano-Irving, TX | 14.2% | 28.4% | 9.5% | 10.7% | $92,495 | 11.3% |
| 119 | Washington-Arlington-Alexandria, DC-VA-MD-WV | 14.2% | 27.6% | 9.0% | 8.7% | $128,402 | 7.9% |
| 120 | New York-Jersey City-White Plains, NY-NJ | 13.8% | 23.6% | 10.1% | 7.9% | $110,849 | 12.8% |
| 121 | College Station-Bryan, TX | 13.4% | 30.8% | 9.4% | $64,918 | 24.6% | |
| 122 | Miami-Fort Lauderdale-West Palm Beach, FL | 13.3% | 27.0% | 10.9% | 13.1% | $81,633 | 14.3% |
| 123 | Kahului-Wailuku-Lahaina, HI | 12.4% | 23.4% | 9.7% | $101,541 | 9.7% |
Frequently Asked Questions
Which cities have the highest rates of depression?
The prevalence of depression can vary among cities and regions. While specific rankings may change over time, some cities that have been identified with higher rates of depression include:
- Anchorage, Alaska
- Portland, Oregon
- St. Louis, Missouri
- Salt Lake City, Utah
- Charleston, West Virginia
What are the potential reasons for higher rates of depression in certain cities?
The higher rates of depression in certain cities may be attributed to several factors, such as:
- Limited access to mental healthcare services: Some cities may have a shortage of mental healthcare providers or limited access to affordable mental health services, leading to undiagnosed or untreated depression.
- High stress levels: Cities with high levels of stress due to factors like demanding work environments, traffic congestion, or high cost of living can contribute to increased rates of depression.
- Seasonal factors: Cities with long winters or limited sunlight may experience higher rates of depression, as seasonal affective disorder (SAD) can impact mental health.
- Socioeconomic factors: Cities with higher poverty rates, income inequality, or unemployment rates may have increased vulnerability to depression among their residents.
Which cities have the lowest rates of depression?
Identifying cities with the lowest rates of depression can be challenging, as the data may vary and change over time. However, some cities that have been identified as having lower rates of depression include:
- Honolulu, Hawaii
- San Francisco, California
- Minneapolis, Minnesota
- Burlington, Vermont
- Raleigh, North Carolina
Are there specific initiatives or resources available in cities with high rates of depression?
Many cities with high rates of depression have implemented initiatives and resources to address mental health challenges. These initiatives may include:
- Increased access to mental healthcare: Cities may work to improve access to mental health services by partnering with community organizations, expanding mental health clinics, or implementing telehealth programs.
- Mental health awareness campaigns: Cities may launch public awareness campaigns to reduce stigma around mental health and promote early intervention and help-seeking behaviors.
- Support groups and community programs: Local organizations may provide support groups, counseling services, and community programs aimed at individuals experiencing depression or other mental health concerns.
- Workplace mental health initiatives: Cities may collaborate with employers to develop workplace mental health programs that support employee well-being and provide resources for managing stress and mental health challenges.
Are there online support communities or forums for individuals with depression?
Yes, there are online support communities and forums where individuals with depression can connect with others facing similar challenges. These communities provide a platform to share experiences, seek advice, and offer support. Some popular online communities for individuals with depression include:
- Depression and Bipolar Support Alliance (DBSA) Online Support Groups: DBSA offers online support groups for individuals living with depression and bipolar disorder. These moderated groups provide a safe space to connect with others, share experiences, and gain support.
- Reddit Communities: Reddit has several communities or “subreddits” dedicated to mental health, including r/depression and r/mentalhealth. These communities allow individuals to share their experiences, seek advice, and find support from others who understand.
- Mental Health America’s Online Support Community: Mental Health America hosts an online community called Inspire, where individuals can join specific groups related to depression and connect with others facing similar challenges.

Get a FREE Quote in Minutes
Insurance rates change constantly — we help you stay ahead by making it easy to compare top options and save.